Back to templates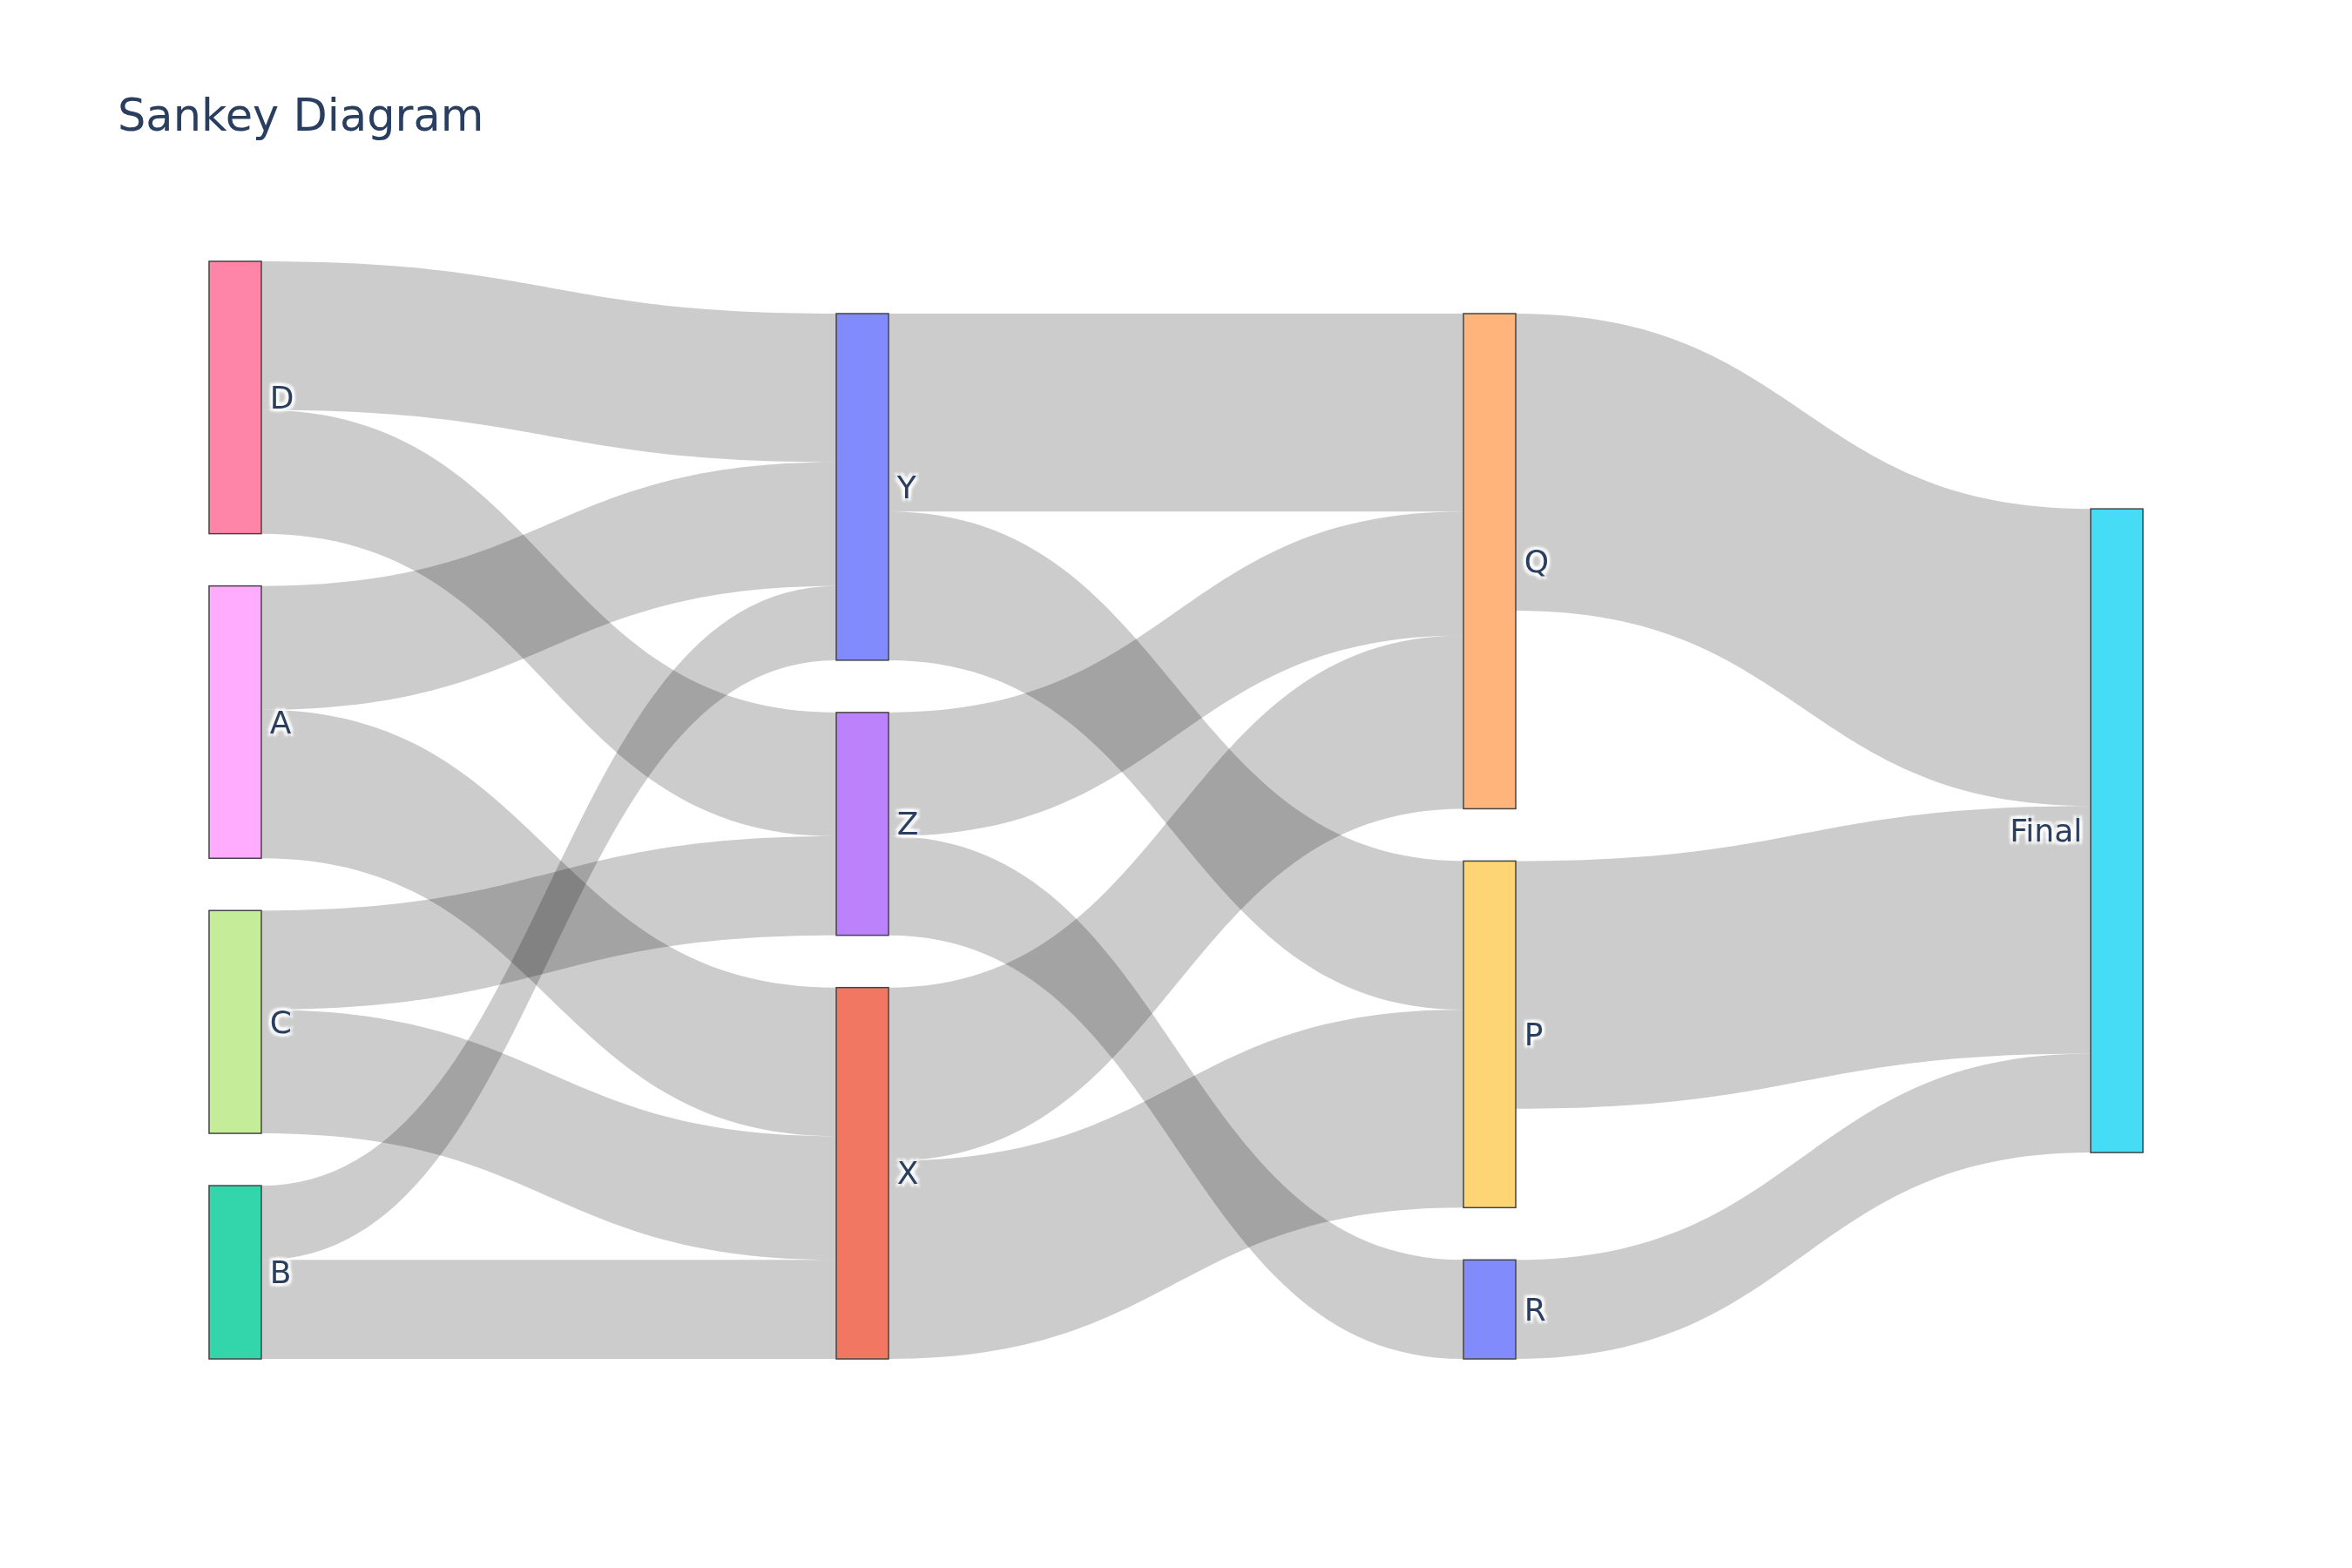
Plotly Advanced Sankey diagram
EngineeringAdvanced Sankey diagram, Show flow distribution and transformation in complex systems.
Publisher: Xiao
Published: 2026/6/3
ID: 83
Usage: 0·Views: 0·Favorites: 0
PYTHONcustom
Parameters (4)
- • Width (Default: 9)
- • Height (Default: 6)
- • DPI (Default: 300)
- • Chart title (Default: Sankey Diagram)
Template Inheritance
Parent:None
Children:None
Data Format Requirements
Required Columns
- sourceTextRequired
- targetTextRequired
- valueTextRequired
Example Data
You can directly copy and save as data.csv for upload.
source,target,value
A,X,30
A,Y,25
B,X,20
B,Y,15
C,X,25
C,Z,20
D,Y,30
D,Z,25
X,P,40
X,Q,35
Y,P,30
Y,Q,40
Z,Q,25
Z,R,20
P,Final,50
Q,Final,60
R,Final,20Chart Preview
How to Use
1.Extract/Search/Create Template
Upload images to let AI extract templates in one click, search and select templates, or create templates.
2.View Sample Data
View sample data and manually or via AI modify the data structure to meet template requirements.
3.Upload Data & Run
Upload data, run the template, preview results, and adjust parameters/code to modify the template and chart.
4.Save & Export Chart
Export charts in PNG / JPG / SVG / PDF formats or save to OOPLOT.